
Thoughts on cloud alerts from the top cloud MDR
Primer on different types of alerts in the cloud, and how you can spot risky business
TL;DR
Cloud and traditional security alerts differ fundamentally in volume, complexity, and context requirements
Effective cloud alert management demands unified monitoring, intelligent processing, and extensive automation
Navigating Cloud Security Alerts
Cloud security alerts are like the alerts generated in on-prem environments - notifying security teams about potential threats, vulnerabilities, and suspicious activities. But the differences require different methods of handling them.
Cloud environments are inherently complex and constantly changing - generating a far higher volume of alerts (and higher false positives). These alerts tell you something notable has occurred, but it’s difficult to understand what’s happened - or what you should do next. Team silos create further challenges, as security teams often lack the permissions needed to make changes, and they have to pull in stakeholders in engineering to help. With broadly distributed, highly interconnected hybrid infrastructure, the impact of errors can be much greater at scale.
This comprehensive guide examines the distinctive characteristics of cloud security alerts and provides proven methodologies for transforming overwhelming alert streams into effective security operations.
Defining cloud security alerts
Cloud alerts are generated by analysis of raw data logged from network traffic, user behavior, system and configuration changes. There are several key types of cloud alerts, and each brings with it its own unique logs and data.
Cloud configuration change alerts
Updates to security groups, resource or network configurations, and identity and access management (IAM) policies are captured by cloud logs. When these updates fall within the scope of a rule, they trigger a real-time alert. These alerts can be a key indicator of unauthorized, non-compliant, or illicit changes that can create a misconfigurations.
Identity and access management (IAM) alerts
IAM events—including API calls, user authentication and authorization events, role assumption, and IAM-related system events—can signal atypical or improper resource access or privilege escalation that might indicate a real-time breach or compliance violation. This data is typically captured by a cloud platform’s IAM logs.
Data on IAM events includes the behavior of both human users and non-human identities (NHIs), such as service accounts, API keys, and OAuth tokens. In fact, NHIs contribute an extreme volume of IAM alerts because they typically outnumber human identities many times over. Service accounts, a common type of NHI, often perform automated tasks that operate continuously, generating a constant stream of IAM events.
Data alerts
Data alerts play important roles in data loss prevention (DLP) and in secrets monitoring for Kubernetes environments. A broad range of data can trigger these alerts, including:
API logs can show suspicious or unauthorized attempts to access cloud-based data or Kubernetes secrets.
Network traffic logs track the flow of data to and from cloud environments, using SSL/TLS inspection to examine encrypted traffic for sensitive data.
Data from scans of cloud storage services and databases implemented to detect and classify sensitive data at rest.
Network alerts
Network alerts play an especially important role in ensuring the security of distributed cloud and hybrid infrastructures. The raw data that can trigger these alerts comes from numerous security and networking components, including:
Network flow logs of IP traffic flowing through network interfaces in the cloud environment.
Load balancing logs indicating incoming traffic patterns and distribution across servers, which can indicate a possible distributed denial-of-service (DDoS) attack.
Network firewall logs tracking traffic monitoring and filtering activity to protect the network infrastructure from unauthorized access, including allowing and blocking connections to cloud resources.
Intrusion detection systems (IDS) and intrusion prevention system logs that can flag network traffic for suspicious activities and potential attacks.
DNS server logs that can reveal potential domain-based threats.
Kubernetes events
The security of Kubernetes environments is vital, given the role these environments play in orchestrating communications and moving resources across networks. CSP logs capture events in various Kubernetes components, including:
Kubernetes API server events within the cluster, such as state changes, errors, and activities.
Kubelet events related to pod and container lifecycle, resource usage, and node-specific issues.
Container runtime events like image pulling or the starting and stopping of containers.
Platform-specific Kubernetes events are captured in logs for Amazon Elastic Kubernetes Engine (Amazon EKS), Azure Kubernetes Service (AKS), Google Kubernetes Engine (GKE), and Oracle Cloud Infrastructure (OCI).
Endpoint events
Endpoint agents collect data directly from hosts. This data includes details on process creation and termination, file system changes, network connections, Windows registry modifications, and other activity that can indicate potential compromises of cloud resources.
Application events
Logging data on application activity can provide visibility into illicit activity, misconfigurations, performance issues, unauthorized access, and other potential vulnerabilities or indicators of compromise (IOCs). Application events are triggered by the analysis of data from sources that include:
API logs capturing requests, responses, and errors for API calls made to cloud services.
Web application firewall (WAF) logs showing activity to protect web applications and APIs from application-layer attacks, such as SQL injection or cross-site scripting, by analyzing HTTP traffic to detect and block malicious requests.
Runtime application self-protection (RASP) logs of authentication and authorization events, data exfiltration attempts, abnormal input, database query anomalies, API misuse, and other real-time application security events.
Application logs generated by the an app itself to capture specific events, errors, and user actions.
SaaS events
SaaS solutions hosted and run in the cloud can represent a major part of an organization’s attack surface. Security logs for these applications are captured by both secure access service edge (SASE) and cloud access security broker (CASB). They include information on user authentication and authorization attempts, user activity, data flows between users and SaaS solutions, and the devices accessing cloud resources. Based on this data, SASE and CASB solutions can provide visibility into signs of malware, account compromise, and anomalous behaviors such as unusual login patterns or data access attempts that can indicate a security incident.
How are cloud alerts different—and what risks do they pose?
Cloud security alerts and their on-prem counterparts indicate many of the same kinds of events, and they play similar roles in security operations. But it’s important to understand what makes cloud alerts different so you can navigate them effectively, and beware of common red flags popping up, too.

Complexity
Distributed environments pose major hurdles to visibility and understanding. Cloud resources are often spread across multiple regions and services, making it hard to correlate alerts and identify broader attack patterns. These problems are multiplied when working with multiple CSPs, as most organizations do.
Consider this scenario: A multinational corporation uses a multi-cloud strategy with services spread across AWS, Azure, and Google Cloud Platform (GCP). Its development teams in North America, Europe, and Asia each use different cloud services and regions within these platforms. One day, the company’s security team receives the following cloud alerts:
Unusual spikes in API calls from an IP address in Eastern Europe to an AWS S3 bucket in the US.
Several failed login attempts to an Azure Active Directory instance in Western Europe.
Unexpected outbound traffic from a GCP instance in Asia to an unknown IP address.
Each alert arrives on a separate monitor in a different format, and each refers to a different type of service. The team can’t see the alerts together within a unified view of their entire multi-cloud ecosystem—which makes it hard to see how they might relate to each other. Meanwhile, new alerts continue to flood into the security operations center (SOC) to compete for their attention.
Signs that your team might be facing this issue include:
Fragmented alerting systems: Separate alerting mechanisms for each cloud platform make it challenging to track and correlate incidents.
Inconsistent alert prioritization: Different platforms categorize and prioritize alerts differently, leading to confusion and inconsistent response protocols.
Redundant alerts across platforms: The same incident generates alerts on multiple platforms, creating noise and confusion with no unified view.
Constant change
The real-time scalability and automation of cloud resources enable constant, rapid change in the environment—ensuring the flexibility and agility organizations seek from the cloud. However, these changes lead to a high volume to manage and decipher, including many of the types that could indicate an attack. Constant change also makes it hard to establish a baseline of expected behavior for the environment to help tune out false positives. On the CSP end, frequent updates to products, features, and APIs add yet another dimension of change.
Your team may be feeling the effects of constant change if you’re experiencing:
Alert fatigue: Overwhelming alert volume can lead team members to ignore or delay alert responses.
High number of unresolved alerts: Backlogs of unresolved alerts often grow—their volume exceeding team capacity.
Repeated alerts from the same source: Frequent alerts on the same issue can point to an underlying problem or ineffective alert thresholds. Unless overburdened security teams can find time to adjust their alert thresholds, they have no way of knowing.
Prioritization
When security teams face deluges of cloud alerts, they have to make fast decisions about what to address first. With important details missing—for example, the IP address of the relevant device or the activity history of the user involved—they can’t accurately assess each alert’s relevance and impact. So their decisions are based on gut instinct rather than real insight, making mistakes and unfortunate outcomes inevitable.
Prioritization is likely a challenge for your team if you’re seeing:
Failure to identify high-impact alerts: Teams can’t quickly distinguish critical alerts from minor ones, leading to delayed response for high-risk incidents.
Over-prioritization of non-critical alerts: When minor alerts take up a disproportionate amount of response time, high-risk alerts may be missed.
Context
Even prioritized alerts lack the context to help teams understand what they mean and what to do about them. To begin with, it can be hard to determine whether an alert is a true positive, which is unlikely, given that nearly all alerts—cloud or otherwise—are actually false positives. And with cloud alerts, the sheer volume of alerts makes the challenge that much greater.
And the alert is just the tip of the iceberg. It’s enough to indicate that something has happened. But far more information remains hidden beneath the surface, including the details security teams need to answer their most urgent questions:
Does it matter?
What is it?
Where is it?
When did it get here?
How did it get here?
How did we detect it?
What should we do?
For CISOs and directors of security, signs that security teams need more context for their alerts include:
True positives ignored: If your security team has been ignoring or dismissing legitimate alerts that might have helped avert an incident, it may be because they’re spending too much of their time chasing false positives.
Delays in responding to real threats: The significant manual effort required to understand and prioritize a large volume of contextless alerts often leads to delays in responding to real threats.
Missed critical alerts: If the security team is unable to accurately determine whether alerts are relevant, or whether multiple alerts are connected to the same underlying incident, it may be because they lack key details like user or system data.
Organizational silos
It can take multiple teams to understand, investigate, and respond to the situation indicated by one or more cloud alerts. Security teams may spot the problem, but they often lack the privileges or authority to remediate it directly. Instead, they have to go to developers, cloud architects, or cloud infrastructure teams and convince them to fix it. This can cause disastrous delays and bottlenecks.
Silos can come into play before an incident even arises. As infrastructure teams build out the cloud environment, they don’t always put security front and center. By the time SecOps teams come into the picture, there’s already a gap between what security requires and what the infrastructure team has set up.
The signs of problematic organizational silos include:
No defined incident escalation path: Unclear protocols for escalating security incidents lead to delays and missed SLAs.
Lack of follow-up after incidents or pen tests: If real or simulated security breaches aren’t leading to cross-team collaboration on systemic changes, your organization will remain at risk for similar incidents.
Inconsistent incident documentation: A lack of comprehensive record-keeping on alert response actions across teams results in incomplete follow-up and analysis.
No post-incident review: When teams don’t coordinate across silos to review and learn from incidents, the organization can’t identify areas for improvement in alert handling.
Best practices for cloud alerts
The challenges posed by cloud alerts are significant, but they’re not insurmountable. Security organizations can gain a clearer understanding of cloud security events—and how to handle them—when they use these best practices to address these issues head-on.
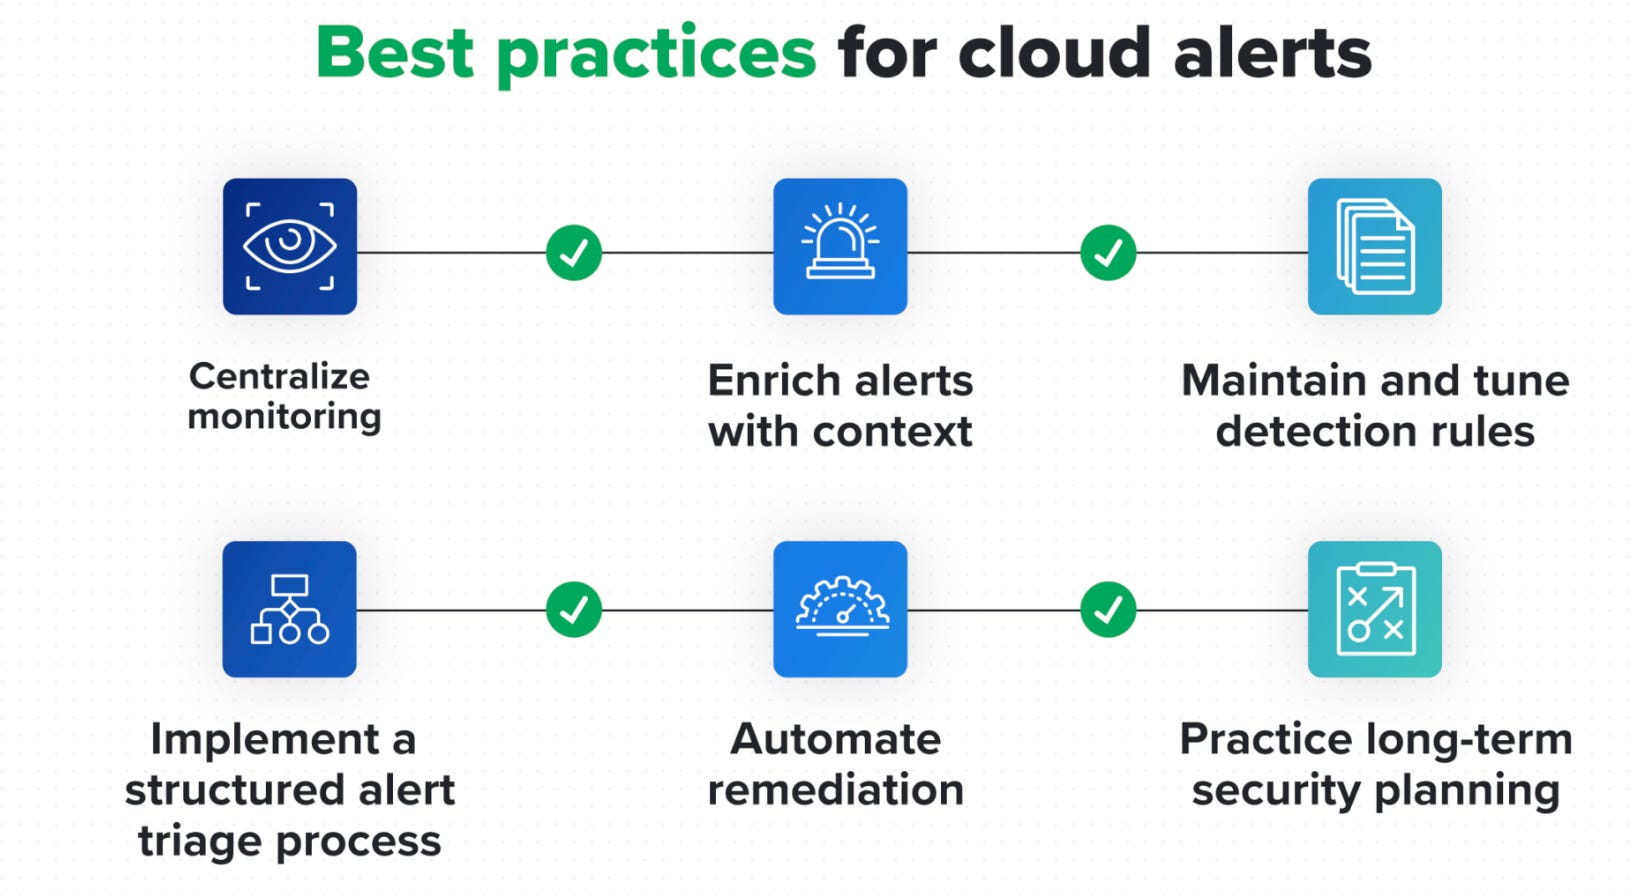
Centralize monitoring
The first step is to reduce the visibility challenges of working with multiple cloud service providers (CSPs). When you consolidate all alerts within a single interface, analysts don’t have to jump from screen to screen. And they have a complete view of the multi-cloud environment for more effective prioritization and troubleshooting.
In the case of the multinational corporation’s scenario described above, a unified view could help the security team connect the three alerts across platforms to reveal a single, coordinated cyberattack:
Initial access attempt: The spike in API calls to the AWS S3 bucket from Eastern Europe could represent an attacker’s attempt to gain access to the organization’s cloud resources.
Lateral movement: The failed login attempts to Azure Active Directory in Western Europe might indicate that the attacker is trying to use credentials obtained from the AWS environment to move laterally within the organization’s infrastructure.
Command and control: The unexpected outbound traffic from the GCP instance in Asia to an unknown IP address could suggest that the attacker has successfully compromised this instance and is using it as a command and control server to coordinate further attacks or exfiltrate data.
How Expel centralizes monitoring
Expel Managed Detection and Response (MDR) uses APIs to ingest and normalize security data throughout our customers’ cloud environments. We present it in a single interface for our own security teams and for our customers. This centralized telemetry enables faster, more accurate analysis and response to cloud alerts.
Implement a structured security alert triage process
As cloud alerts come in, security teams need a consistent and reliable way to identify the most urgent ones first. Information on users, devices, and past incidents can be vital to understanding the potential severity of each event. Analysts should have a clear, repeatable process to answer questions like:
Is sensitive data at risk?
Are users in multiple locations attempting to gain escalated privileges?
Has there been a spike in API calls from an unfamiliar IP address?
Your triage process should include a feedback mechanism to continually assess and refine the way you interpret and prioritize alerts for optimal accuracy.
When you help security teams quickly identify the most critical threats while filtering out innocuous events, you can reduce alert fatigue, allocate resources more efficiently, and respond more effectively when it matters most.
How Expel triages alerts
Expel uses AI-powered automation and proprietary detection rules to filter millions of alerts each day and remove false positives, while escalating those requiring human judgment to our SOC team. Expel analysts use information on the customer’s user roles and behaviors, device usage, and past incidents to gain deeper understandings of each alert. And they cross-correlate information from the customer’s complex infrastructure to see how different alerts might be related.
These insights are correlated with threat intelligence to identify relevant indicators of compromise (IOCs). The insights are also integrated with information about the customer’s own environment to better understand the severity of a potential incident. Through this process, our team can quickly zero in on the most critical and damaging threats.
Enrich alerts with context
As investigations proceed, analysts need as much context as possible to fully understand each incident and how to respond. This can include not only details on users, devices, and behaviors, but also similar past incidents, related activities and alerts, third-party intelligence, and recommended next steps.
For example, an alert on a CPU spike on an EC2 instance could be enriched with context such as:
Instance details (ID, type, region): Where is this instance running? Are there other applications running on it? Is it in a location associated with elevated risk?
Current CPU usage and historical trend: Has this kind of spike occurred before? Under what circumstances?
Recent changes: Have there been auto-scaling events or application deployments that might help explain the spike?
Network traffic and memory usage: Are other resources spiking in tandem with CPU usage?
Logs from the application running on the instance: Does the CPU spike represent an increase in routine usage, or do unusual workloads or user counts indicate something more exceptional?
Relevant IAM activities: Are any users working in unfamiliar locations, on unusual devices, or in non-customary roles?
How Expel enriches alerts
After filtering out false positives, Expel uses AI automation to add extensive context to the remaining alerts. This helps our analysts evaluate the right next step to take in an investigation. Context includes:
Alert similarity: By recognizing common patterns and similarities within a high volume of alerts, we can provide our analysts with suggestions about new alerts based on observed past activities and outcomes.
Third-party intelligence: Threat intelligence on attacker indicators of compromise (IOCs), indicators of attack (IOAs), and tactics, techniques, and procedures (TTPs) helps analysts identify an incident, understand its implications, and anticipate the attacker’s next move. Open-source intelligence (OSINT) provides additional information on the IP addresses from which suspect traffic originates, such as their reputation and involvement in past incidents.
Asset information: Discovery data on systems, devices, and relationships in the customer’s cloud environment provides insight into the potential criticality and impact of an incident. How is the affected service connected to other services, data, and the corporate network? Where could a threat that’s entered the environment travel?
IAM actions: Information about user roles, privileges, and normal behavior can shed light on unusual access or activity.
Resilience recommendations: The same rich context that provides insight into alerts also informs next steps for rapid threat and vulnerability mitigation, now and for the long-term future. With clear, real-time guidance, security teams can work more quickly and effectively to reduce risk and limit an attack’s blast radius.
Automate remediation
Not every alert calls for human intervention. Automated remediation can quickly address common and lower-level vulnerabilities and misconfigurations, while allowing security teams to focus on more-critical events and incidents. In some cases, remediations can be triggered automatically without waiting for human review. For other cases, organizations can require human approval before executing automated remediation steps. In either situation, automation can be invaluable for keeping pace with high-volume cloud alerts, reducing MTTR, and easing the burden on security teams.
Many types of cloud alerts are suitable for automation. For example:
Detection of unusual API activity in a cloud environment can trigger an automated remediation that temporarily revokes the user’s access and notifies the security team.
Discovery of a misconfigured firewall rule can trigger an automated correction to the rule.
Alerts for large data transfers or unexpected outbound traffic to suspicious IP addresses can trigger automated workflows to block traffic, quarantine instances, and notify security teams.
How Expel automates remediations
Expel provides autoremediations personalized to the security preferences of our customers and the frequency of threats seen in their environments. Customers can choose which of many available autoremediations to implement, including:
Removing malicious email (phishing, business email compromise).
Removing malicious files, including ransomware and other malware.
Blocking bad hashes associated with malicious email content.
Containing hosts and disabling user accounts following an incident.
Maintain and tune detection rules
Cloud detection rules are a moment in time, not a steady state. Your cloud resources, CSP services, workloads, and user behaviors change constantly, and so do the threats you face. It’s critical to continually validate and update your rules to accurately distinguish between normal and malicious activities, recognize evolving risks, and enable fast and accurate threat identification and response. Typical types of tuning include:
Adding exceptions: Excluding known benign activities or trusted sources.
Adjusting thresholds: Modifying alert triggers based on the number of times a given event occurs or its correlation with other types of events.
Refining query filters: Improving the specificity of detection logic.
Modifying risk scores: Assigning lower scores to authorized activities.
Indications that tuning may be needed include:
Spikes in alert volume: A sudden increase in alerts could result from configuration changes or legitimate new activities that are being flagged incorrectly.
High false positive rate: If many alerts are classified as false positives, your detection thresholds may be set too low.
Changes in your cloud environment: As your cloud usage evolves, many rules will likely need adjustment to adapt to new baselines.
Cloud provider updates: New features often affect alert activity and call for modifications to detection rules.
How Expel ensures optimally effective detections
Expel maintains open dialogues with our partners to constantly update our detection rules for the benefit of everyone in our network. This includes sharing our latest knowledge on:
DUETs (Did yoU expect this?): Labels applied to alerts that should bypass the SOC and immediately trigger a customer notification and the creation of an incident or investigation—used when the customer requests to surface an alert outside our existing detection strategy, or when analyst triage is unnecessary or impossible based on provided information.
BOLOs (Be on the look out): Reports that inform security teams of specific current threats to watch for, including identifying information.
Our detection and response process: Refinements made to the way our security team configures detection rules, handles alerts, and investigates and mediates threats.
The process we use to evaluate and enhance our detections spans the lifecycle—from ideation and development to testing and deployment.
At the ideation stage, we identify areas where an organization may need new or updated detection rules based on considerations such as:
Customer activity: Are there events we could have detected earlier?
Strategic investigations: Are there new threat vectors or technologies with implications for our customers’ cloud security?
Threat bulletins: What new TPPs, IOCs, or IOAs should we incorporate into our detection roles?
Vendor product updates: Have changes in the cloud services our customers use necessitated adjustments in our alerts?
Anomalies: What have we learned from past anomalies, the alerts they’ve triggered, and their relevance to customer security?
Pen testing: What have our regular penetration tests revealed about the accuracy and relevance of our detections?
As we start to develop new rules or modifications, we address:
Data architecture: What log sources do we need as evidence for our hypothesis? Does our architecture support our standards for alert speed and the breadth of our lookback period?
Detection development: We develop new detection logic using our Golang-based detection engine to identify specific patterns, anomalies, or security threats within data or systems.
SOC triage support: To help our security team adapt to our changes, we:
Draft a description of each new or modified detection
Collaborate on triage steps and training
Integrate any relevant AI/ML and workflow automations
Provide a map to key references for the rule
All of our new and modified detections undergo thorough testing, including:
Backtesting: Detections are tuned further based on their performance against historical data across a variety of environments.
Beta testing: We evaluate each detection in a sample of live environments, and continue to tune them based on fidelity, SOC response time, and customer feedback.
As new rules are deployed for all customers, we continue to monitor their performance for anomalies and identify future opportunities for improvement.
Practice long-term security planning
Your cloud alerts are a valuable source of information about the cloud security of your cloud resources. The insights you gather can help you architect a more secure environment, reduce alert volume, and adopt a more proactive approach to improve security posture over time. Here are some measures you could implement:
Generate examples of cloud alerts and trends to inform security investment priorities.
Trace the sources of specific alerts to prevent false positives in infrastructure-as-code, or catch them in the pipeline with policy-as-code.
Tweak golden images to reduce configurations that can lead to false positives or real vulnerabilities.
Define cloud landing zones to limit recurring issues and better protect high-risk resources.
Modify IAM roles in response to changing alert patterns to ensure that access policies remain relevant and effective along least privilege as the cloud environment evolves.
Conclusion
Our exploration highlights the fundamental differences between cloud and on-prem security alerts. While on-prem alerts often stem from static, well-defined environments, cloud alerts must contend with dynamic, rapidly evolving contexts and ephemeral resources. This shift demands not only a rethinking of how alerts are generated and prioritized but also a commitment to integrating automated context enrichment and intelligent triage.
By implementing best practices for cloud security alerts—such as fine-tuning alert thresholds, leveraging automation and AI-driven tools, and ensuring seamless integration with incident response workflows—organizations can dramatically reduce false positives and improve their overall security posture. Embracing these strategies is key to transforming alerting from a reactive, noisy process into a proactive, targeted defense mechanism in the ever-changing cloud landscape.
This post was originally published on Expel's blog (see pt. 1, 2) - the leading cloud MDR. Reach out personally or see resources below how Expel can help:
Cloud Alert Management in Action: see an example of end-to-end cloud alert handling with Expel, or read about how Expel MDR helped The Meet Group with lower insurance premiums based on stronger security programs, save Venable LLP about $1 million in costs needed for 24×7x365 coverage, and onboard Visa in seven days, and increasing M&A security efficiency by 10–15%.
Cloud Mind Maps: A guide to the tactics used most often during attacks AWS, Azure, GCP, and Kubernetes environments, including the services where attacks originate, the API calls made, and tips for investigating related incidents.
Oh Noes! Our IR Tabletop: an RPG drawing on “Dungeons & Dragons” and “Stars Without Number,” - combining them with more traditional cyber tabletop exercises. In Oh Noes! you and your coworkers create characters with unique abilities and skills. Then, you role-play through cybersecurity incidents specific to your organization.
eBooks on Plugging Cloud Security Gaps: practical insights on Strategic fixes for critical cloud security challenges, including: cloud service misconfiguration prevention, data loss protection strategies, API security enhancement, malware defense techniques, and IAM control optimization - particularly in Azure
Google’s Cloud Security Podcast: hear directly from our CEO and our experiences across hundreds of environments on what good Detection & Response looks like in the cloud